Core-to-Core Latency
Let's measure the inter-core latencies of one of the compute nodes of Noctua 1 at PC2.
using ThreadPinning
latencies = ThreadPinning.bench_core2core_latency()
40×40 Matrix{Float64}:
0.0 217.05 204.85 206.0 203.3 204.95 211.7 205.2 209.5 210.1 209.65 209.3 198.7 194.95 … 271.1 267.5 265.0 260.85 266.9 267.15 265.8 266.7 265.55 258.85 262.1 263.95 269.4
215.55 0.0 214.65 215.15 219.8 222.1 219.55 217.1 223.1 224.7 220.25 219.45 213.2 214.6 266.6 269.45 269.85 270.6 271.25 271.1 267.45 265.65 263.15 259.85 260.85 263.2 267.45
224.2 214.75 0.0 216.05 217.35 219.25 216.45 212.95 219.15 224.4 221.45 219.65 214.55 215.75 270.35 272.55 270.95 275.0 272.15 272.95 267.5 264.15 260.35 263.2 260.8 262.2 264.65
218.4 216.7 211.9 0.0 220.05 218.5 213.2 215.35 225.85 226.7 220.15 218.7 218.6 216.1 266.85 265.75 266.0 265.8 264.7 265.25 259.7 260.9 260.25 258.6 259.6 262.75 262.0
221.95 218.5 217.25 212.7 0.0 221.6 220.15 223.75 226.15 224.0 219.45 220.2 214.35 219.3 264.55 267.0 262.6 262.35 264.2 262.2 262.2 263.25 262.4 262.35 264.3 263.7 262.55
219.85 212.5 214.6 216.25 218.75 0.0 221.5 221.45 222.6 223.8 227.35 222.8 217.95 221.55 … 265.75 267.95 263.8 264.5 265.4 262.95 265.7 264.55 261.9 263.7 265.25 259.95 261.35
219.15 214.0 214.65 217.8 218.85 217.9 0.0 217.15 227.75 225.6 224.05 217.4 216.8 215.15 266.85 269.95 267.85 264.1 262.55 266.15 267.6 267.1 266.25 263.75 260.95 264.4 267.9
⋮ ⋮ ⋮ ⋱ ⋮ ⋮
269.75 265.85 263.4 265.65 265.0 266.8 265.8 264.15 261.35 258.3 262.65 264.45 265.5 268.05 216.55 221.35 219.5 221.05 220.1 211.45 0.0 219.05 219.45 214.95 213.8 212.75 214.9
267.95 265.7 262.2 262.75 262.0 266.35 264.1 260.45 257.4 264.05 268.05 259.85 264.6 265.4 218.6 225.85 226.8 219.3 220.75 215.7 215.95 0.0 221.05 218.35 214.5 214.2 217.3
265.65 262.7 263.2 261.8 261.7 260.8 260.95 257.55 259.15 262.05 264.95 263.1 259.55 259.75 … 221.15 223.75 222.8 226.45 226.25 221.05 221.8 219.6 0.0 215.2 216.55 220.45 222.2
264.4 263.0 265.85 263.6 265.35 257.25 254.2 258.5 261.6 259.95 259.45 262.3 262.65 259.25 219.0 217.95 218.6 223.2 220.75 215.1 215.2 218.25 216.35 0.0 215.75 216.8 220.15
258.75 262.2 264.2 262.55 262.4 262.6 259.05 258.65 257.5 259.4 265.45 260.1 260.2 261.6 217.4 220.85 219.15 218.05 214.5 214.15 215.8 224.5 217.2 217.35 0.0 218.75 222.8
264.5 263.35 257.0 262.9 258.65 264.95 266.05 260.75 259.15 264.8 263.95 265.5 267.3 265.35 221.95 222.65 224.25 221.05 220.95 216.5 220.25 220.5 217.2 218.5 218.05 0.0 223.1
266.6 266.35 262.65 262.2 264.45 267.2 266.8 264.25 263.75 262.75 264.5 266.55 267.4 271.6 223.9 226.0 225.6 228.65 225.3 219.85 218.25 220.55 220.75 217.1 220.2 225.15 0.0Of course, it is easier to make sense of the result if we visualize it. Here, we use Plots.jl's heatmap function.
using Plots
heatmap(latencies; c = :viridis, frame=:box)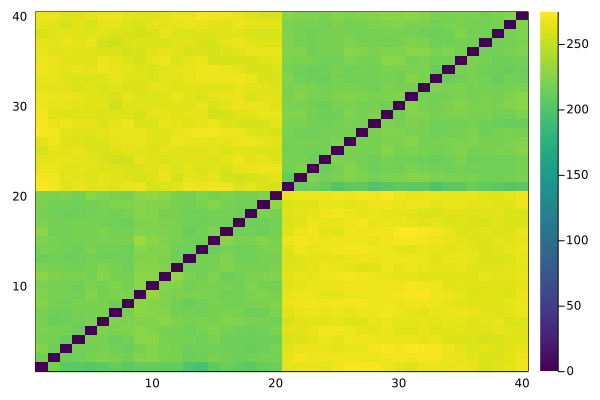
The two sockets / CPUs of the system with 20 cores each are clearly visible since the inter-core latency of cores on different sockets is, expectedly, higher than the same for cores sitting on the same socket / in the same CPU. Note that due to fluctuations in our imperfect benchmark the result is not precisely symmetric (which, of course, it should be in theory).